Top Six Dashboard
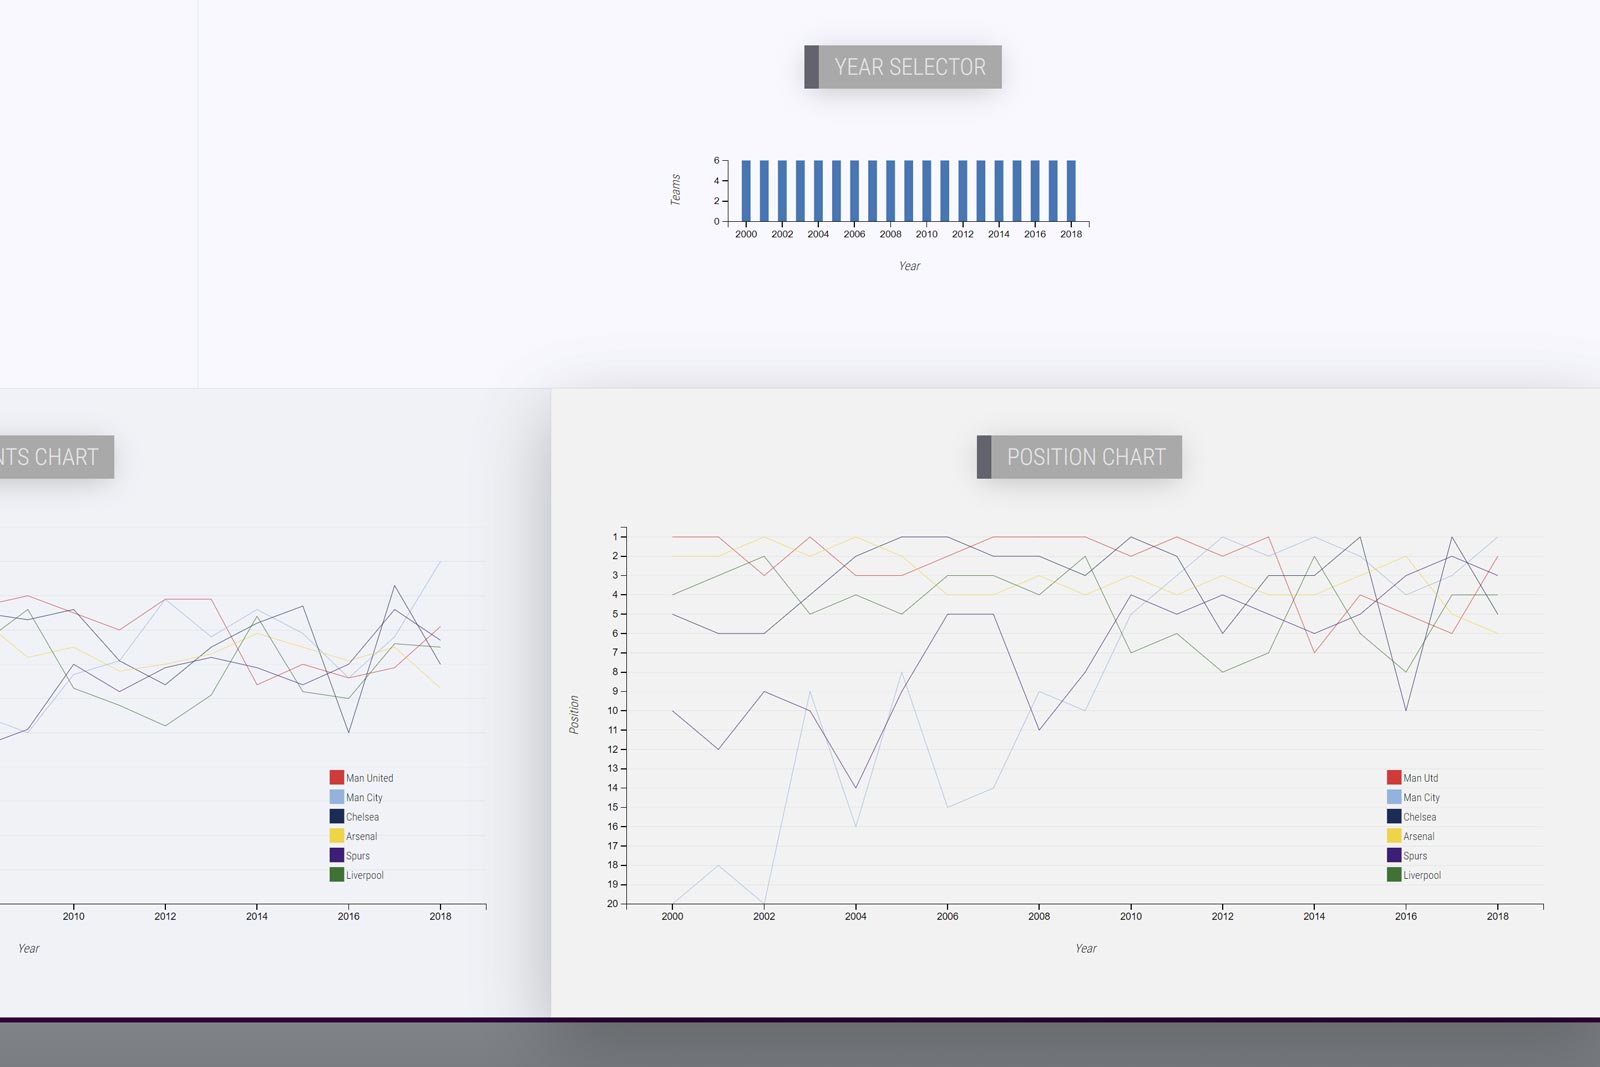
The TOP SIX DASHBOARD is a data-rich dashboard allowing you to compare the statistics of six of the biggest teams in English football.
Project Background
The Top Six Dashboard is built on top of well-known JavaScript charting libraries in D3, DC and Crossfilter to bring to you a fresh new look on how the current top six sides in the Premier League compare.
With an elegant and responsive UI, this web application is crafted to make your experience the number one priority in terms of usability - even if your favourite Premier League team haven’t performed well.

The End Product
The Top Six Dashboard takes on the intricacies of working on a project which features a huge array of modern web technologies. This includes front-end frameworks and libraries like Bootstrap, D3 and DC along with SASS. Things get more interesting for the back-end using too, where I’m using Flask, a Python microframework with all the data held in MongoDB.
This dashboard enables you to dive into the stats of your favourite Premier League teams and compare them with other title contenders over the years. You can now visualise the journey of your favourite teams in this data rich dashboard analysing their end of season results and comparing them with the remaining title rivals.


